

In this, we’ll learn to set up an ElasticSearch on AWS EC2. Elastic Stack consists of ElasticSearch, Filebeat, LogStash, and Kibana(ELK stack) which brings all the logs and traces into a single place. This is one of the most popular tools for storing and viewing logs.
In Elastic Stack—
ElasticSearch is used to store data.
Filebeat transfers the logs into ElasticSearch through LogStash
LogStash filters the logs
Kibana helps in visualizing the data and navigating the logs.
Without wasting time, let’s dive into how to set up ElasticSearch on AWS EC2 using Terraform.
Note: You can set up ElasticSearch alone if you don’t want to configure other loggings and visualizations.
Prerequisites
- AWS and Terraform Knowledge
- AWS Credentials
To know about what is Terraform and how this works, check out this article.
Why Run Your Own ElasticSearch On AWS EC2 Instead Of Hosted Services?
We can create ElasticSearch in AWS either by using Elastic Cloud or by using AWS ElasticSearch Service(OpenSearch). But running our own ElasticSearch on AWS EC2 instead of hosted services has the following advantages:
- Cheaper
- Full control over configuration, accessibility, and visibility.
- Easy plugins installation
- Access logs
- Perform any configuration changes
- No boundary in choosing any instance type
Creating ElasticSearch on AWS EC2 (Elastic Stack)
Here we’ll create an elastic stack in a VPC, and set up Filebeat on EC2 which helps to view logs, then, LogStash to apply some filters to the data/logs. All the logs are created and stored inside /var/log. Filebeat takes all these logs and sends them to LogStash. LogStash then applies filters to send them to ElasticSearch.
Finally, Kibana will be configured to display logs from ElasticSearch. Which can be accessed from the Kibana dashboard.
Note: You can get all the configuration source codes, here.
Configuration Set-Up(Important)
To set up the configuration for each component, first, we need to install components on our EC2 server. For the sake of simplicity, we’ll be using terraform data_template method to replace the default file. And it must be done before starting the component.
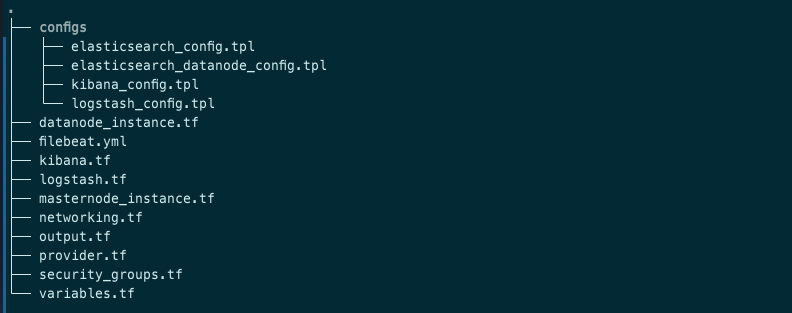
All the config files are stored inside ./configs directory.
VPC, subnets set-up
Create networking.tf with the following content:
#basic setup
resource "aws_vpc" "elastic_stack_vpc"{
  cidr_block = cidrsubnet("172.20.0.0/16",0,0)
  tags={
    Name="gallerist-elasticsearch_vpc"
  }
}
resource "aws_internet_gateway" "elastic_stack_ig" {
  vpc_id = aws_vpc.elastic_vpc.id
  tags = {
    Name = "galleirst_elasticsearch_igw"
  }
}
resource "aws_route_table" "elastic_stack_rt" {
  vpc_id = aws_vpc.elastic_vpc.id
  route {
    cidr_block = "0.0.0.0/0"
    gateway_id = aws_internet_gateway.elastic_internet_gateway.id
  }
  tags = {
    Name = "gallerist_elasticsearch_rt"
  }
}
resource "aws_main_route_table_association" "elastic_stack_rt_main" {
  vpc_id         = aws_vpc.elastic_vpc.id
  route_table_id = aws_route_table.elastic_rt.id
}
resource "aws_subnet" "elastic_stack_subnet"{
  for_each = {ap-south-1a=cidrsubnet("172.20.0.0/16",8,10),ap-south-1b=cidrsubnet("172.20.0.0/16",8,20)}
  vpc_id = aws_vpc.elastic_vpc.id
  availability_zone = each.key
  cidr_block = each.value
  tags={
    Name="elasticsearch_subnet_${each.key}"
  }
}
Now, Setup ElasticSearach Cluster:
ElasticSearch Cluster Set-Up
In this, I’ll set up two master-node and one data-node ElasticSearch cluster in multiple/different AZs. In the security group for ElasticSearch, add the inbound access rule to port 9200. This is required so that Kibana can access it.
Create security_groups.tf file and add the following:
# elasticsearch security group
resource "aws_security_group" "elasticsearch_sg" {
  vpc_id = var.vpc_id
  description = "ElasticSearch Security Group"
  ingress {
    description = "ingress rules"
    cidr_blocks = [ "0.0.0.0/0" ]
    from_port = 22
    protocol = "tcp"
    to_port = 22
  }
  ingress {
    description = "ingress rules"
    from_port = 9200
    protocol = "tcp"
    to_port = 9300
    security_groups = [aws_security_group.kibana_sg.id] # Kibana security group to access ElasticSearch
  }

  ingress {
    description = "ingress rules"
    from_port = 9200
    protocol = "tcp"
    to_port = 9300
    security_groups = [var.lambda_sg] # If you're using lambda to access ES.
  }

  egress {
    description = "egress rules"
    from_port   = 0
    protocol    = "-1"
    to_port     = 0
    cidr_blocks = ["0.0.0.0/0"]
  }
  tags={
    Name="elasticsearch_sg"
  }
}
ElasticSearch master nodes:
Create file elastic_masternodes.tf:
# Elastic-Search master nodes
resource "aws_key_pair" "elastic_ssh_key" {
  key_name="elasticsearch_ssh"
  public_key= file("~/.ssh/elasticsearch_keypair.pub")
}
resource "aws_instance" "elastic_nodes" {
  count                  = 2
  ami                    = var.elastic_aws_ami
  instance_type          = var.elastic_aws_instance_type
  # subnet_id              = aws_subnet.elastic_subnet[var.azs[count.index]].id
  subnet_id              = var.public_subnet_ids[count.index]
  vpc_security_group_ids = [aws_security_group.elasticsearch_sg.id]
  key_name               = aws_key_pair.elastic_ssh_key.key_name
  iam_instance_profile   = "${aws_iam_instance_profile.elastic_ec2_instance_profile.name}"
  associate_public_ip_address = true
  tags = {
    Name = "elasticsearch dev node-${count.index}"
  }
}
data "template_file" "init_elasticsearch" {
  depends_on = [
    aws_instance.elastic_nodes
  ]
  count          = 2
  template = file("./configs/elasticsearch_config.tpl")
  vars = {
    cluster_name = "elasticsearch_cluster"
    node_name    = "node_${count.index}"
    node         = aws_instance.elastic_nodes[count.index].private_ip
    node1        = aws_instance.elastic_nodes[0].private_ip
    node2        = aws_instance.elastic_nodes[1].private_ip
    node3        = aws_instance.elastic_datanodes[0].private_ip
  }
}

resource "aws_eip" "elasticsearch_eip"{
    count     = 2
    instance  = element(aws_instance.elastic_nodes.*.id, count.index)
    vpc       = true

    tags = {
    Name = "elasticsearch-eip-${terraform.workspace}-${count.index + 1}"
  }
}

resource "null_resource" "move_es_file" {
  count          = 2
  connection {
     type        = "ssh"
     user        = "ec2-user"
     private_key = file("~/.ssh/elasticsearch_keypair.pem")
     host        = aws_instance.elastic_nodes[count.index].public_ip
  }
  provisioner "file" {
    content      = data.template_file.init_elasticsearch[count.index].rendered
    destination  = "elasticsearch.yml"
  }

  provisioner "file" {
    content      = data.template_file.init_backupscript[count.index].rendered
    destination  = "s3_backup_script.sh"

  }

}
resource "null_resource" "start_es" {
  depends_on     = [
    null_resource.move_es_file
  ]
  count          = 2
  connection {
     type        = "ssh"
     user        = "ec2-user"
     private_key = file("~/.ssh/elasticsearch_keypair.pem")
     host        = aws_instance.elastic_nodes[count.index].public_ip
  }
  provisioner "remote-exec" {
    inline = [
      "#!/bin/bash",
      "sudo yum update -y",
      "sudo yum install java-1.8.0 -y",
      "sudo rpm -i <https://artifacts.elastic.co/downloads/elasticsearch/elasticsearch-7.16.1-x86_64.rpm>",
      "sudo systemctl daemon-reload",
      "sudo systemctl enable elasticsearch.service",
      "sudo chmod -R 777 /etc/elasticsearch",
      "sudo sed -i 's@-Xms1g@-Xms${aws_instance.elastic_nodes[count.index].root_block_device[0].volume_size/2}g@g' /etc/elasticsearch/jvm.options",
      "sudo sed -i 's@-Xmx1g@-Xmx${aws_instance.elastic_nodes[count.index].root_block_device[0].volume_size/2}g@g' /etc/elasticsearch/jvm.options",
      # "sudo sed -i 's/#network.host: 192.168.0.1/network.host: 0.0.0.0/g' /etc/elasticsearch/elasticsearch.yml",
      "sudo rm /etc/elasticsearch/elasticsearch.yml",
      "sudo cp elasticsearch.yml /etc/elasticsearch/",
      "sudo systemctl start elasticsearch.service",
    ]
  }
}
Create datanode_instance.tf:
# Elastic-Search data nodes setup
resource "aws_key_pair" "elastic_datanode_ssh_key" {
  key_name="elasticsearch_datanode_ssh"
  public_key= file("~/.ssh/elasticsearch_keypair.pub")
}
resource "aws_instance" "elastic_datanodes" {
  count                  = 1
  ami                    = var.elastic_aws_ami
  instance_type          = var.elastic_aws_instance_type
  # subnet_id              = aws_subnet.elastic_subnet[var.azs[count.index]].id
  subnet_id              = var.public_subnet_ids[count.index]
  vpc_security_group_ids = [aws_security_group.elasticsearch_sg.id]
  key_name               = aws_key_pair.elastic_ssh_key.key_name
  iam_instance_profile   = "${aws_iam_instance_profile.elastic_ec2_instance_profile.name}"
  associate_public_ip_address = true
  tags = {
    Name = "elasticsearch dev node-${count.index + 2}"
  }
}
data "template_file" "init_es_datanode" {
  depends_on = [
    aws_instance.elastic_datanodes
  ]
  count          = 1
  template = file("./configs/elasticsearch_datanode_config.tpl")
  vars = {
    cluster_name = "elasticsearch_cluster"
    node_name    = "datanode_${count.index}"
    node         = aws_instance.elastic_datanodes[count.index].private_ip
    node1        = aws_instance.elastic_nodes[0].private_ip
    node2        = aws_instance.elastic_nodes[1].private_ip
    node3        = aws_instance.elastic_datanodes[0].private_ip
  }
}

# Uncomment following if you want to attach elastic IP to your data nodes.
# resource "aws_eip" "elasticsearch_datanode_eip"{
#     count     = 1
#     instance  = element(aws_instance.elastic_datanodes.*.id, count.index)
#     vpc       = true

#     tags = {
#     Name = "elasticsearch-eip-datanode-${count.index + 1}"
#   }
# }

resource "null_resource" "move_es_datanode_file" {
  count          = 1
  connection {
     type        = "ssh"
     user        = "ec2-user"
     private_key = file("~/.ssh/elasticsearch_keypair.pem")
     host        = aws_instance.elastic_datanodes[count.index].public_ip
  }
  provisioner "file" {
    content      = data.template_file.init_es_datanode[count.index].rendered
    destination  = "elasticsearch_datanode.yml"
  }

  provisioner "file" {
    content      = data.template_file.init_backupscript_datanode[count.index].rendered
    destination  = "s3_backup_script.sh"

  }

}
resource "null_resource" "start_es_datanodes" {
  depends_on     = [
    null_resource.move_es_datanode_file
  ]
  count          = 1
  connection {
     type        = "ssh"
     user        = "ec2-user"
     private_key = file("~/.ssh/elasticsearch_keypair.pem")
     host        = aws_instance.elastic_datanodes[count.index].public_ip
  }
  provisioner "remote-exec" {
    inline = [
      "#!/bin/bash",
      "sudo yum update -y",
      "sudo yum install java-1.8.0 -y",
      "sudo rpm -i <https://artifacts.elastic.co/downloads/elasticsearch/elasticsearch-7.16.1-x86_64.rpm>",
      "sudo systemctl daemon-reload",
      "sudo systemctl enable elasticsearch.service",
      "sudo chmod -R 777 /etc/elasticsearch",
      "sudo sed -i 's@-Xms1g@-Xms${aws_instance.elastic_datanodes[count.index].root_block_device[0].volume_size/2}g@g' /etc/elasticsearch/jvm.options",
      "sudo sed -i 's@-Xmx1g@-Xmx${aws_instance.elastic_datanodes[count.index].root_block_device[0].volume_size/2}g@g' /etc/elasticsearch/jvm.options",
      # "sudo sed -i 's/#network.host: 192.168.0.1/network.host: 0.0.0.0/g' /etc/elasticsearch/elasticsearch.yml",
      "sudo rm /etc/elasticsearch/elasticsearch.yml",
      "sudo cp elasticsearch_datanode.yml /etc/elasticsearch/elasticsearch.yml",
      "sudo systemctl start elasticsearch.service"
    ]
  }
}
Add config file inside configs directory, elasticsearch_config.tpl:
# ======================== Elasticsearch Configuration =========================
#
# NOTE: Elasticsearch comes with reasonable defaults for most settings.
#       Before you set out to tweak and tune the configuration, make sure you
#       understand what are you trying to accomplish and the consequences.
#
# The primary way of configuring a node is via this file. This template lists
# the most important settings you may want to configure for a production cluster.
#
# Please consult the documentation for further information on configuration options:
# https://www.elastic.co/guide/en/elasticsearch/reference/index.html
#
# ---------------------------------- Cluster -----------------------------------
#
# Use a descriptive name for your cluster:
#
cluster.name: ${cluster_name}
#
# ------------------------------------ Node ------------------------------------
#
# Use a descriptive name for the node:
#
node.name: ${node_name}
#
# Add custom attributes to the node:
#
#node.attr.rack: r1
#
# ----------------------------------- Paths ------------------------------------
#
# Path to directory where to store the data (separate multiple locations by comma):
#
path.data: /var/lib/elasticsearch
#
# Path to log files:
#
path.logs: /var/log/elasticsearch
#
# ----------------------------------- Memory -----------------------------------
#
# Lock the memory on startup:
#
#bootstrap.memory_lock: true
#
# Make sure that the heap size is set to about half the memory available
# on the system and that the owner of the process is allowed to use this
# limit.
#
# Elasticsearch performs poorly when the system is swapping the memory.
#
# ---------------------------------- Network -----------------------------------
#
# Set the bind address to a specific IP (IPv4 or IPv6):
#
network.host: ${node}
#
# Set a custom port for HTTP:
#
http.port: 9200
#
# For more information, consult the network module documentation.
#
# --------------------------------- Discovery ----------------------------------
#
# Pass an initial list of hosts to perform discovery when this node is started:
# The default list of hosts is ["127.0.0.1", "[::1]"]
#

discovery.seed_hosts: ["${node1}", "${node2}", "${node3}"]
#
# Bootstrap the cluster using an initial set of master-eligible nodes:
#

cluster.initial_master_nodes: ["${node1}", "${node2}"]


# node.roles: [master, voting_only]
#
# For more information, consult the discovery and cluster formation module documentation.
#
# ---------------------------------- Gateway -----------------------------------
#
# Block initial recovery after a full cluster restart until N nodes are started:
#
#gateway.recover_after_nodes: 3
#
# For more information, consult the gateway module documentation.
#
# ---------------------------------- Various -----------------------------------
#
# Require explicit names when deleting indices:
#
#action.destructive_requires_name: true
And elasticsearch_datanode_config.tpl:
# ======================== Elasticsearch Configuration =========================
#
# NOTE: Elasticsearch comes with reasonable defaults for most settings.
#       Before you set out to tweak and tune the configuration, make sure you
#       understand what are you trying to accomplish and the consequences.
#
# The primary way of configuring a node is via this file. This template lists
# the most important settings you may want to configure for a production cluster.
#
# Please consult the documentation for further information on configuration options:
# https://www.elastic.co/guide/en/elasticsearch/reference/index.html
#
# ---------------------------------- Cluster -----------------------------------
#
# Use a descriptive name for your cluster:
#
cluster.name: ${cluster_name}
#
# ------------------------------------ Node ------------------------------------
#
# Use a descriptive name for the node:
#
node.name: ${node_name}
#
# Add custom attributes to the node:
#
#node.attr.rack: r1
#
# ----------------------------------- Paths ------------------------------------
#
# Path to directory where to store the data (separate multiple locations by comma):
#
path.data: /var/lib/elasticsearch
#
# Path to log files:
#
path.logs: /var/log/elasticsearch
#
# ----------------------------------- Memory -----------------------------------
#
# Lock the memory on startup:
#
#bootstrap.memory_lock: true
#
# Make sure that the heap size is set to about half the memory available
# on the system and that the owner of the process is allowed to use this
# limit.
#
# Elasticsearch performs poorly when the system is swapping the memory.
#
# ---------------------------------- Network -----------------------------------
#
# Set the bind address to a specific IP (IPv4 or IPv6):
#
network.host: ${node}
#
# Set a custom port for HTTP:
#
http.port: 9200
#
# For more information, consult the network module documentation.
#
# --------------------------------- Discovery ----------------------------------
#
# Pass an initial list of hosts to perform discovery when this node is started:
# The default list of hosts is ["127.0.0.1", "[::1]"]
#

discovery.seed_hosts: ["${node1}", "${node2}", "${node3}"]
#
# Bootstrap the cluster using an initial set of master-eligible nodes:
#

cluster.initial_master_nodes: ["${node1}", "${node2}"]

# node.roles: [data]
#
# For more information, consult the discovery and cluster formation module documentation.
#
# ---------------------------------- Gateway -----------------------------------
#
# Block initial recovery after a full cluster restart until N nodes are started:
#
#gateway.recover_after_nodes: 3
#
# For more information, consult the gateway module documentation.
#
# ---------------------------------- Various -----------------------------------
#
# Require explicit names when deleting indices:
#
#action.destructive_requires_name: true
Kibana Set-Up
In security_groups.tf, add the following:
resource "aws_security_group" "kibana_sg" {
  vpc_id = aws_vpc.elastic_stack_vpc.id
  ingress {
    description = "ingress rules"
    cidr_blocks = [ "0.0.0.0/0" ]
    from_port = 22
    protocol = "tcp"
    to_port = 22
  }
  ingress {
    description = "ingress rules"
    cidr_blocks = [ "0.0.0.0/0" ]
    from_port = 5601
    protocol = "tcp"
    to_port = 5601
  }
  egress {
    description = "egress rules"
    cidr_blocks = [ "0.0.0.0/0" ]
    from_port = 0
    protocol = "-1"
    to_port = 0
  }
  tags={
    Name="kibana_security_group"
  }
}
Kibana:
# Kibana setup
resource "aws_instance" "kibana" {
  depends_on = [
    null_resource.start_es
   ]
  ami                    = "ami-0ed9277fb7eb570c9"
  instance_type          = "t2.small"
  subnet_id              = aws_subnet.elastic_subnet[var.az_name[0]].id
  vpc_security_group_ids = [aws_security_group.kibana_sg.id]
  key_name               = aws_key_pair.elastic_ssh_key.key_name
  associate_public_ip_address = true
  tags = {
    Name = "kibana"
  }
}
data "template_file" "init_kibana" {
  depends_on = [
    aws_instance.kibana
  ]
  template = file("./configs/kibana_config.tpl")
  vars = {
    elasticsearch = aws_instance.elastic_nodes[0].public_ip
  }
}
resource "null_resource" "move_kibana_file" {
  depends_on = [
    aws_instance.kibana
   ]
  connection {
     type        = "ssh"
     user        = "ec2-user"
     private_key = file("elasticsearch_keypair.pem")
     host        = aws_instance.kibana.public_ip
  }
  provisioner "file" {
    content     = data.template_file.init_kibana.rendered
    destination = "kibana.yml"
  }
}

resource "null_resource" "install_kibana" {
  depends_on = [
      aws_instance.kibana
   ]
  connection {
    type        = "ssh"
    user        = "ec2-user"
    private_key = file("elasticsearch_keypair.pem")
    host        = aws_instance.kibana.public_ip
  }
  provisioner "remote-exec" {
    inline = [
      "sudo yum update -y",
      "sudo rpm -i <https://artifacts.elastic.co/downloads/elasticsearch/elasticsearch-7.16.1-x86_64.rpm>",
      "sudo rm /etc/kibana/kibana.yml",
      "sudo cp kibana.yml /etc/kibana/",
      "sudo systemctl start kibana"
    ]
  }
}
Inside configs directory add a new file kibana_config.tpl:
# Kibana is served by a back end server. This setting specifies the port to use.
#server.port: 5601

# Specifies the address to which the Kibana server will bind. IP addresses and host names are both valid values.
# The default is 'localhost', which usually means remote machines will not be able to connect.
# To allow connections from remote users, set this parameter to a non-loopback address.
server.host: "0.0.0.0"

# Enables you to specify a path to mount Kibana at if you are running behind a proxy.
# Use the `server.rewriteBasePath` setting to tell Kibana if it should remove the basePath
# from requests it receives, and to prevent a deprecation warning at startup.
# This setting cannot end in a slash.
#server.basePath: ""

# Specifies whether Kibana should rewrite requests that are prefixed with
# `server.basePath` or require that they are rewritten by your reverse proxy.
# This setting was effectively always `false` before Kibana 6.3 and will
# default to `true` starting in Kibana 7.0.
#server.rewriteBasePath: false

# The maximum payload size in bytes for incoming server requests.
#server.maxPayloadBytes: 1048576

# The Kibana server's name.  This is used for display purposes.
server.name: "kibana"

# The URLs of the Elasticsearch instances to use for all your queries.
elasticsearch.hosts: ["http://${elasticsearch}:9200"]

# When this setting's value is true Kibana uses the hostname specified in the server.host
# setting. When the value of this setting is false, Kibana uses the hostname of the host
# that connects to this Kibana instance.
#elasticsearch.preserveHost: true

# Kibana uses an index in Elasticsearch to store saved searches, visualizations and
# dashboards. Kibana creates a new index if the index doesn't already exist.
#kibana.index: ".kibana"

# The default application to load.
#kibana.defaultAppId: "home"

# If your Elasticsearch is protected with basic authentication, these settings provide
# the username and password that the Kibana server uses to perform maintenance on the Kibana
# index at startup. Your Kibana users still need to authenticate with Elasticsearch, which
# is proxied through the Kibana server.
#elasticsearch.username: "kibana"
#elasticsearch.password: "pass"

# Enables SSL and paths to the PEM-format SSL certificate and SSL key files, respectively.
# These settings enable SSL for outgoing requests from the Kibana server to the browser.
#server.ssl.enabled: false
#server.ssl.certificate: /path/to/your/server.crt
#server.ssl.key: /path/to/your/server.key

# Optional settings that provide the paths to the PEM-format SSL certificate and key files.
# These files validate that your Elasticsearch backend uses the same key files.
#elasticsearch.ssl.certificate: /path/to/your/client.crt
#elasticsearch.ssl.key: /path/to/your/client.key

# Optional setting that enables you to specify a path to the PEM file for the certificate
# authority for your Elasticsearch instance.
#elasticsearch.ssl.certificateAuthorities: [ "/path/to/your/CA.pem" ]

# To disregard the validity of SSL certificates, change this setting's value to 'none'.
#elasticsearch.ssl.verificationMode: full

# Time in milliseconds to wait for Elasticsearch to respond to pings. Defaults to the value of
# the elasticsearch.requestTimeout setting.
#elasticsearch.pingTimeout: 1500

# Time in milliseconds to wait for responses from the back end or Elasticsearch. This value
# must be a positive integer.
#elasticsearch.requestTimeout: 30000

# List of Kibana client-side headers to send to Elasticsearch. To send *no* client-side
# headers, set this value to [] (an empty list).
#elasticsearch.requestHeadersWhitelist: [ authorization ]

# Header names and values that are sent to Elasticsearch. Any custom headers cannot be overwritten
# by client-side headers, regardless of the elasticsearch.requestHeadersWhitelist configuration.
#elasticsearch.customHeaders: {}

# Time in milliseconds for Elasticsearch to wait for responses from shards. Set to 0 to disable.
#elasticsearch.shardTimeout: 30000

# Time in milliseconds to wait for Elasticsearch at Kibana startup before retrying.
#elasticsearch.startupTimeout: 5000

# Logs queries sent to Elasticsearch. Requires logging.verbose set to true.
#elasticsearch.logQueries: false

# Specifies the path where Kibana creates the process ID file.
#pid.file: /var/run/kibana.pid

# Enables you specify a file where Kibana stores log output.
#logging.dest: stdout

# Set the value of this setting to true to suppress all logging output.
#logging.silent: false

# Set the value of this setting to true to suppress all logging output other than error messages.
#logging.quiet: false

# Set the value of this setting to true to log all events, including system usage information
# and all requests.
#logging.verbose: false

# Set the interval in milliseconds to sample system and process performance
# metrics. Minimum is 100ms. Defaults to 5000.
#ops.interval: 5000

# Specifies locale to be used for all localizable strings, dates and number formats.
# Supported languages are the following: English - en , by default , Chinese - zh-CN .
#i18n.locale: "en"
LogStash Set-Up
This takes up logs sent by Filebeats and applies filters to them before sending them to ElasticSearch. For this, add the inbound rule to port 5044.
resource "aws_security_group" "logstash_sg" {
  vpc_id = aws_vpc.elastic_stack_vpc.id
  ingress {
    description = "ingress rules"
    cidr_blocks = [ "0.0.0.0/0" ]
    from_port = 22
    protocol = "tcp"
    to_port = 22
  }
  ingress {
    description = "ingress rules"
    cidr_blocks = [ "0.0.0.0/0" ]
    from_port = 5044
    protocol = "tcp"
    to_port = 5044
  }
  egress {
    description = "egress rules"
    cidr_blocks = [ "0.0.0.0/0" ]
    from_port = 0
    protocol = "-1"
    to_port = 0
  }
  tags={
    Name="logstash_sg"
  }
}
LogStash:
resource "aws_instance" "logstash" {
  depends_on = [
    null_resource.install_kibana
   ]
  ami                            = "ami-04d29b6f966df1537"
  instance_type          = "t2.small"
  subnet_id                 = aws_subnet.elastic_subnet[var.az_name[0]].id
  vpc_security_group_ids = [aws_security_group.logstash_sg.id]
  key_name               = aws_key_pair.elastic_ssh_key.key_name
  associate_public_ip_address = true
  tags = {
    Name = "logstash"
  }
}

data "template_file" "init_logstash" {
  depends_on = [
    aws_instance.logstash
  ]
  template = file("./logstash_config.tpl")
  vars = {
    elasticsearch = aws_instance.elastic_nodes[0].public_ip
  }
}

resource "null_resource" "move_logstash_file" {
  depends_on = [
    aws_instance.logstash
   ]
  connection {
     type        = "ssh"
     user        = "ec2-user"
     private_key = file("~/.ssh/elasticsearch_keypair.pem")
     host        = aws_instance.logstash.public_ip
  }
  provisioner "file" {
    content     = data.template_file.init_logstash.rendered
    destination = "logstash.conf"
  }
}

resource "null_resource" "install_logstash" {
  depends_on = [
      aws_instance.logstash
   ]
  connection {
    type        = "ssh"
    user        = "ec2-user"
    private_key = file("~/.ssh/elasticsearch_keypair.pem")
    host        = aws_instance.logstash.public_ip
  }
  provisioner "remote-exec" {
    inline = [
      "sudo yum update -y && sudo yum install java-1.8.0-openjdk -y",
      "sudo rpm -i <https://artifacts.elastic.co/downloads/elasticsearch/elasticsearch-7.16.1-x86_64.rpm>",
      "sudo cp logstash.conf /etc/logstash/conf.d/logstash.conf",
      "sudo systemctl start logstash.service"
    ]
  }
}
Add logstash_config.tpl file inside configs directory:
# Sample Logstash configuration for creating a simple
# Beats -> Logstash -> Elasticsearch pipeline.

input {
  beats {
    port => 5044
  }
}

output {
  elasticsearch {
    hosts => ["http://${elasticsearch}:9200"]
    index => "logstash"
  }
}
Filebeat Set-Up
It takes logs from /var/logs/ and sends them to LogStash on port 5044.
resource "aws_security_group" "filebeat_sg" {
  vpc_id = aws_vpc.elastic_stack_vpc.id
  ingress {
    description = "ingress rules"
    cidr_blocks = [ "0.0.0.0/0" ]
    from_port = 22
    protocol = "tcp"
    to_port = 22
  }
  egress {
    description = "egress rules"
    cidr_blocks = [ "0.0.0.0/0" ]
    from_port = 0
    protocol = "-1"
    to_port = 0
  }
  tags={
    Name="filebeat_sg"
  }
}
Filebeat:
resource "aws_instance" "filebeat" {
  depends_on = [
    null_resource.install_logstash
   ]
  ami                                    = "ami-04d29b6f966df1537"
  instance_type                  = "t2.small"
  subnet_id                         = aws_subnet.elastic_subnet[var.az_name[0]].id
  vpc_security_group_ids = [aws_security_group.filebeat_sg.id]
  key_name                        = aws_key_pair.elastic_ssh_key.key_name
  associate_public_ip_address = true
  tags = {
    Name = "filebeat"
  }
}

resource "null_resource" "move_filebeat_file" {
  depends_on = [
    aws_instance.filebeat
   ]
  connection {
     type               = "ssh"
     user               = "ec2-user"
     private_key   = file("~/.ssh/elasticsearch_keypair.pem")
     host               = aws_instance.filebeat.public_ip
  }
  provisioner "file" {
    source      = "filebeat.yml"
    destination = "filebeat.yml"
  }
}

resource "null_resource" "install_filebeat" {
  depends_on = [
    null_resource.move_filebeat_file
   ]
  connection {
    type        = "ssh"
    user        = "ec2-user"
    private_key = file("~/.ssh/elasticsearch_keypair.pem")
    host        = aws_instance.filebeat.public_ip
  }
  provisioner "remote-exec" {
    inline = [
      "sudo yum update -y",
      "sudo rpm -i <https://artifacts.elastic.co/downloads/elasticsearch/elasticsearch-7.16.1-x86_64.rpm>",
      "sudo sed -i 's@kibana_ip@${aws_instance.kibana.public_ip}@g' filebeat.yml",
      "sudo sed -i 's@logstash_ip@${aws_instance.logstash.public_ip}@g' filebeat.yml",
      "sudo rm /etc/filebeat/filebeat.yml",
      "sudo cp filebeat.yml /etc/filebeat/",
      "sudo systemctl start filebeat.service"
    ]
  }
}
Add filebeat.yml file in the project directory:
###################### Filebeat Configuration Example #########################

# This file is an example configuration file highlighting only the most common
# options. The filebeat.reference.yml file from the same directory contains all the
# supported options with more comments. You can use it as a reference.
#
# You can find the full configuration reference here:
# https://www.elastic.co/guide/en/beats/filebeat/index.html

# For more available modules and options, please see the filebeat.reference.yml sample
# configuration file.

#=========================== Filebeat inputs =============================

filebeat.inputs:

# Each - is an input. Most options can be set at the input level, so
# you can use different inputs for various configurations.
# Below are the input specific configurations.

- type: log

  # Change to true to enable this input configuration.
  enabled: true

  # Paths that should be crawled and fetched. Glob based paths.
  paths:
    - /var/log/*.log
    #- c:\programdata\elasticsearch\logs\*

  # Exclude lines. A list of regular expressions to match. It drops the lines that are
  # matching any regular expression from the list.
  #exclude_lines: ['^DBG']

  # Include lines. A list of regular expressions to match. It exports the lines that are
  # matching any regular expression from the list.
  #include_lines: ['^ERR', '^WARN']

  # Exclude files. A list of regular expressions to match. Filebeat drops the files that
  # are matching any regular expression from the list. By default, no files are dropped.
  #exclude_files: ['.gz$']

  # Optional additional fields. These fields can be freely picked
  # to add additional information to the crawled log files for filtering
  #fields:
  #  level: debug
  #  review: 1

  ### Multiline options

  # Multiline can be used for log messages spanning multiple lines. This is common
  # for Java Stack Traces or C-Line Continuation

  # The regexp Pattern that has to be matched. The example pattern matches all lines starting with [
  #multiline.pattern: ^\[

  # Defines if the pattern set under pattern should be negated or not. Default is false.
  #multiline.negate: false

  # Match can be set to "after" or "before". It is used to define if lines should be append to a pattern
  # that was (not) matched before or after or as long as a pattern is not matched based on negate.
  # Note: After is the equivalent to previous and before is the equivalent to to next in Logstash
  #multiline.match: after


#============================= Filebeat modules ===============================

filebeat.config.modules:
  # Glob pattern for configuration loading
  path: ${path.config}/modules.d/*.yml

  # Set to true to enable config reloading
  reload.enabled: false

  # Period on which files under path should be checked for changes
  #reload.period: 10s

#==================== Elasticsearch template setting ==========================

setup.template.settings:
  index.number_of_shards: 1
  #index.codec: best_compression
  #_source.enabled: false

#================================ General =====================================

# The name of the shipper that publishes the network data. It can be used to group
# all the transactions sent by a single shipper in the web interface.
#name:

# The tags of the shipper are included in their own field with each
# transaction published.
#tags: ["service-X", "web-tier"]

# Optional fields that you can specify to add additional information to the
# output.
#fields:
#  env: staging


#============================== Dashboards =====================================
# These settings control loading the sample dashboards to the Kibana index. Loading
# the dashboards is disabled by default and can be enabled either by setting the
# options here or by using the `setup` command.
#setup.dashboards.enabled: false

# The URL from where to download the dashboards archive. By default this URL
# has a value which is computed based on the Beat name and version. For released
# versions, this URL points to the dashboard archive on the artifacts.elastic.co
# website.
#setup.dashboards.url:

#============================== Kibana =====================================

# Starting with Beats version 6.0.0, the dashboards are loaded via the Kibana API.
# This requires a Kibana endpoint configuration.
setup.kibana:

  # Kibana Host
  # Scheme and port can be left out and will be set to the default (http and 5601)
  # In case you specify and additional path, the scheme is required: http://localhost:5601/path
  # IPv6 addresses should always be defined as: https://[2001:db8::1]:5601
  host: "kibana_ip:5601"

  # Kibana Space ID
  # ID of the Kibana Space into which the dashboards should be loaded. By default,
  # the Default Space will be used.
  #space.id:

#============================= Elastic Cloud ==================================

# These settings simplify using Filebeat with the Elastic Cloud (https://cloud.elastic.co/).

# The cloud.id setting overwrites the `output.elasticsearch.hosts` and
# `setup.kibana.host` options.
# You can find the `cloud.id` in the Elastic Cloud web UI.
#cloud.id:

# The cloud.auth setting overwrites the `output.elasticsearch.username` and
# `output.elasticsearch.password` settings. The format is `<user>:<pass>`.
#cloud.auth:

#================================ Outputs =====================================

# Configure what output to use when sending the data collected by the beat.

#-------------------------- Elasticsearch output ------------------------------
#output.elasticsearch:
  # Array of hosts to connect to.
  #hosts: ["localhost:9200"]

  # Optional protocol and basic auth credentials.
  #protocol: "https"
  #username: "elastic"
  #password: "changeme"

#----------------------------- Logstash output --------------------------------
output.logstash:
  # The Logstash hosts
  hosts: ["logstash_ip:5044"]

  # Optional SSL. By default is off.
  # List of root certificates for HTTPS server verifications
  #ssl.certificate_authorities: ["/etc/pki/root/ca.pem"]

  # Certificate for SSL client authentication
  #ssl.certificate: "/etc/pki/client/cert.pem"

  # Client Certificate Key
  #ssl.key: "/etc/pki/client/cert.key"

#================================ Processors =====================================

# Configure processors to enhance or manipulate events generated by the beat.

processors:
  - add_host_metadata: ~
  - add_cloud_metadata: ~
  - add_docker_metadata: ~
  - add_kubernetes_metadata: ~

#================================ Logging =====================================

# Sets log level. The default log level is info.
# Available log levels are: error, warning, info, debug
#logging.level: debug

# At debug level, you can selectively enable logging only for some components.
# To enable all selectors use ["*"]. Examples of other selectors are "beat",
# "publish", "service".
#logging.selectors: ["*"]

#============================== X-Pack Monitoring ===============================
# filebeat can export internal metrics to a central Elasticsearch monitoring
# cluster.  This requires xpack monitoring to be enabled in Elasticsearch.  The
# reporting is disabled by default.

# Set to true to enable the monitoring reporter.
#monitoring.enabled: false

# Sets the UUID of the Elasticsearch cluster under which monitoring data for this
# Filebeat instance will appear in the Stack Monitoring UI. If output.elasticsearch
# is enabled, the UUID is derived from the Elasticsearch cluster referenced by output.elasticsearch.
#monitoring.cluster_uuid:

# Uncomment to send the metrics to Elasticsearch. Most settings from the
# Elasticsearch output are accepted here as well.
# Note that the settings should point to your Elasticsearch *monitoring* cluster.
# Any setting that is not set is automatically inherited from the Elasticsearch
# output configuration, so if you have the Elasticsearch output configured such
# that it is pointing to your Elasticsearch monitoring cluster, you can simply
# uncomment the following line.
#monitoring.elasticsearch:

#================================= Migration ==================================

# This allows to enable 6.7 migration aliases
#migration.6_to_7.enabled: true
Now, you have successfully set up Elastic Stack on AWS EC2 using Terraform.
Visit, <public_ip_of_any_es_node>:9200/_cluster/health to see ElasticSearch Status
Visit, <public_ip_of_any_es_node>:9200/_cat/nodes?v to see ElasticSearch nodes
Visit, <public_ip_of_kibana_instance>:5601/_cluster/health to see Kibana
After accessing Kibana, go to settings > Index Patterns > Add the logstash index
To check logs, SSH into each component and run the command
$ sudo systemctl status <component_name> -lThen SSH int Filebeat EC2 instance and add sample .log file inside /var/log/ . And you can search for the logs inside the Kibana dashboard.
For a sample log run the following and see a record on Kibana:
$ echo "echo 'This is a sample log for test' >> /var/log/test-log.log" | sudo bashThat’s It.
Note: You can get all the sourcecodes used in this article, here.
Conclusion
Congratulations, you have successfully learned about how to set up ElasticSearch on AWS EC2 using Terraform. In fact, you set up Elastic Stack on AWS EC2.
Other articles on Terraform:
- Create and deploy Lambda function with terraform
- Configure AWS CloudFront CDN With Certificate Using Terraform
Thank You!